

Global Broker Regulation Inquiry App
About WikiFX
English
简体中文
繁體中文
English
Pусский
日本語
ภาษาไทย
Tiếng Việt
Bahasa Indonesia
Español
हिन्दी
Filippiiniläinen
Français
Deutsch
Português
Türkçe
한국어
العربية
اردو


Forex Noise: Why Most Beginners Get Stopped Out by Random Wiggles

WikiFX
|


Abstract:Forex noise lures beginners into overtrading and losses. This article explains what noise is, where it comes from, and how to stop reacting to every random price wiggle.

 Contents
What Is Forex Noise?
In forex, noise refers to the seemingly random, short‑term price movements that do not reflect a genuine shift in supply, demand, or market sentiment. Think of it as the crackle on a radio station: the music is the trend, and the static is the noise. On a 5‑minute candlestick chart, a chart showing price action in five‑minute blocks, with each block forming a “candle” that indicates the opening, high, low, and closing prices for that period, noise appears as dozens of tiny up‑and‑down bars that, in isolation, signify nothing.
Beginners often mistake this noise for a valuable signal. A green candle lights up, adrenaline kicks in, and a trade is placed. But nine times out of ten, that green candle was just random static. The core problem isn't the noise itself; it's the illusion that every wiggle is a meaningful message.
Where Does Noise Come From?
Forex is the world's most liquid market, with trillions of dollars changing hands daily. This enormous volume means constant trading by banks, funds, corporations, and individual speculators. Each participant places orders for different reasons, creating a constant churn. Even without a major news event, the ticker never stops bouncing.
Low‑liquidity periods, like the Asian session for many currency pairs, can exaggerate seemingly erratic swings. A single large order can push the price a few pips, a pip (short for “percentage in point”) is the smallest standard unit of price movement in forex, usually 0.0001 for most pairs, and 0.01 for yen‑based pairs. Because there are few opposing orders, a move of only a handful of pips can look dramatic. Then, within minutes, the price drifts back. That is textbook noise. Academic research on the random walk hypothesis even suggests that short‑term price changes are largely unpredictable, further confirming that much of what we see on a minute chart is fundamentally meaningless.
The Beginner's Trap: Reacting to Every Twitch
Many newcomers enter the market with a real‑time chart open, eyes glued to the blinking green and red numbers. In that hyper‑alert state, every pip becomes a story. This is where noise wreaks the most damage.
Consider a hypothetical scenario. EUR/USD is idling around 1.1377 during a low‑volatility afternoon. Most of the action stays between 1.1350 and 1.1400, a 50‑pip band that represents the session's equilibrium. Suddenly, a flurry of buy orders pushes the pair 33 pips higher to 1.1410 in less than a minute. A beginner, fearing they are about to miss a massive rally, clicks “buy” at 1.1405. They set a protective stop just below the session's low at 1.1350, say at 1.1349. Within the hour, the price slides to 1.1345, triggering the stop at 1.1349, and then eventually drifts back to 1.1370. That 65‑pip swing from 1.1410 to 1.1345 was not a failed breakout; it was noise, a temporary imbalance that sorted itself out. The beginner, however, is now out of the trade with a loss, frustrated and confused.
This pattern repeats endlessly. The psychological drivers are universal:
- Confirmation bias makes you see the spike as a breakout.
- Fear of missing out (FOMO) compels action without a plan.
- Overreaction to minor moves triggers hasty decisions when calm patience is needed.
None of these are signs of a flawed personality; they are simply human reactions to a chaotic environment.
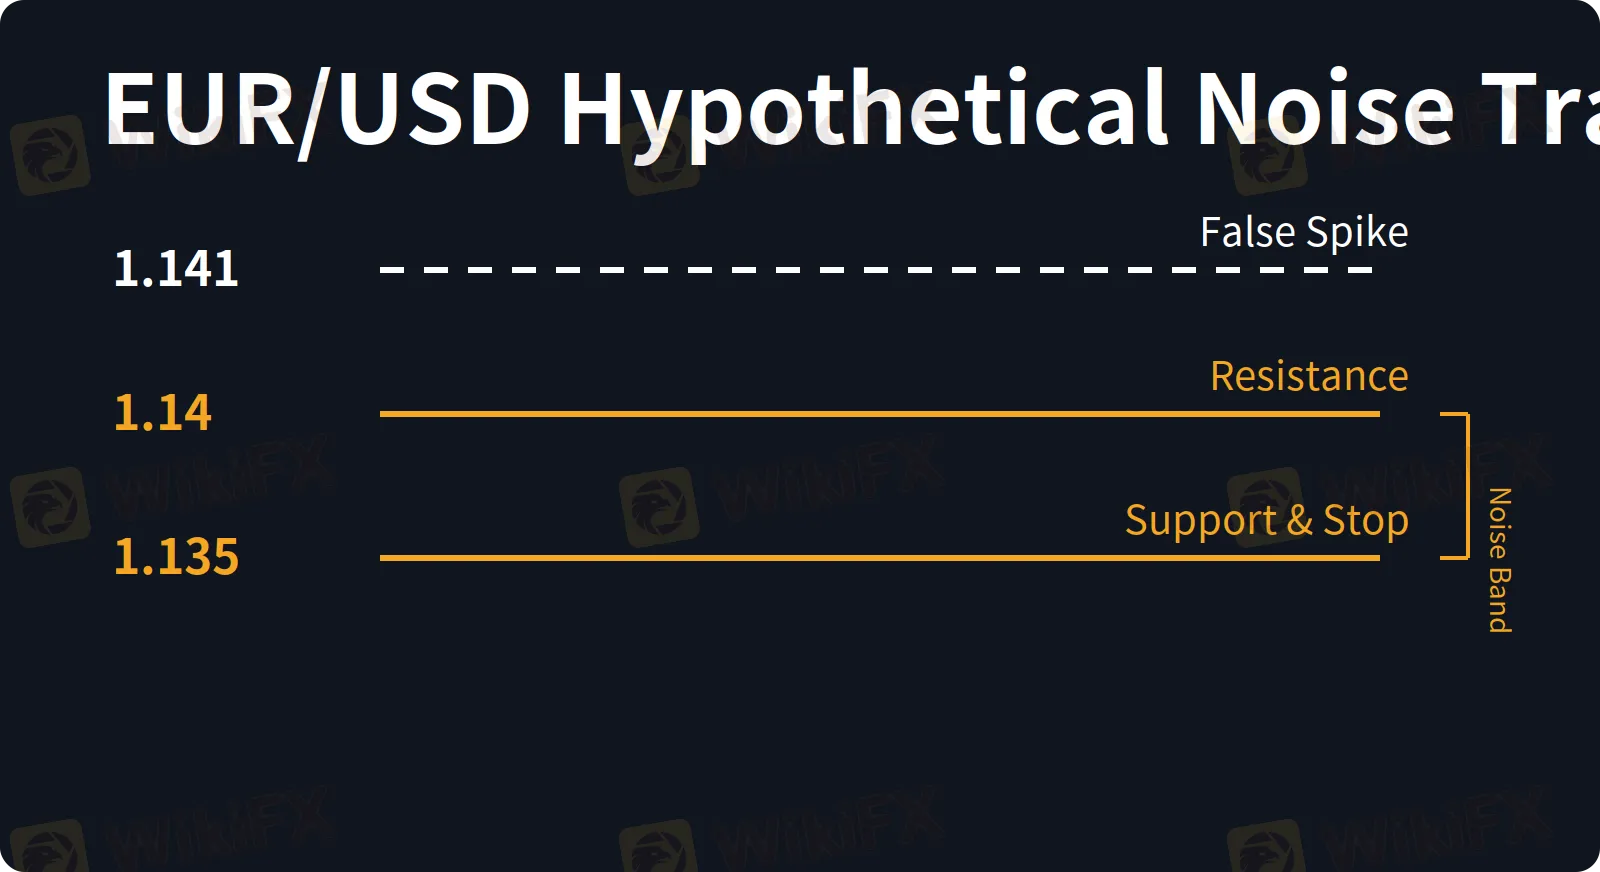
The dashed line marks a false breakout beyond the established range, which reversed within the hour.
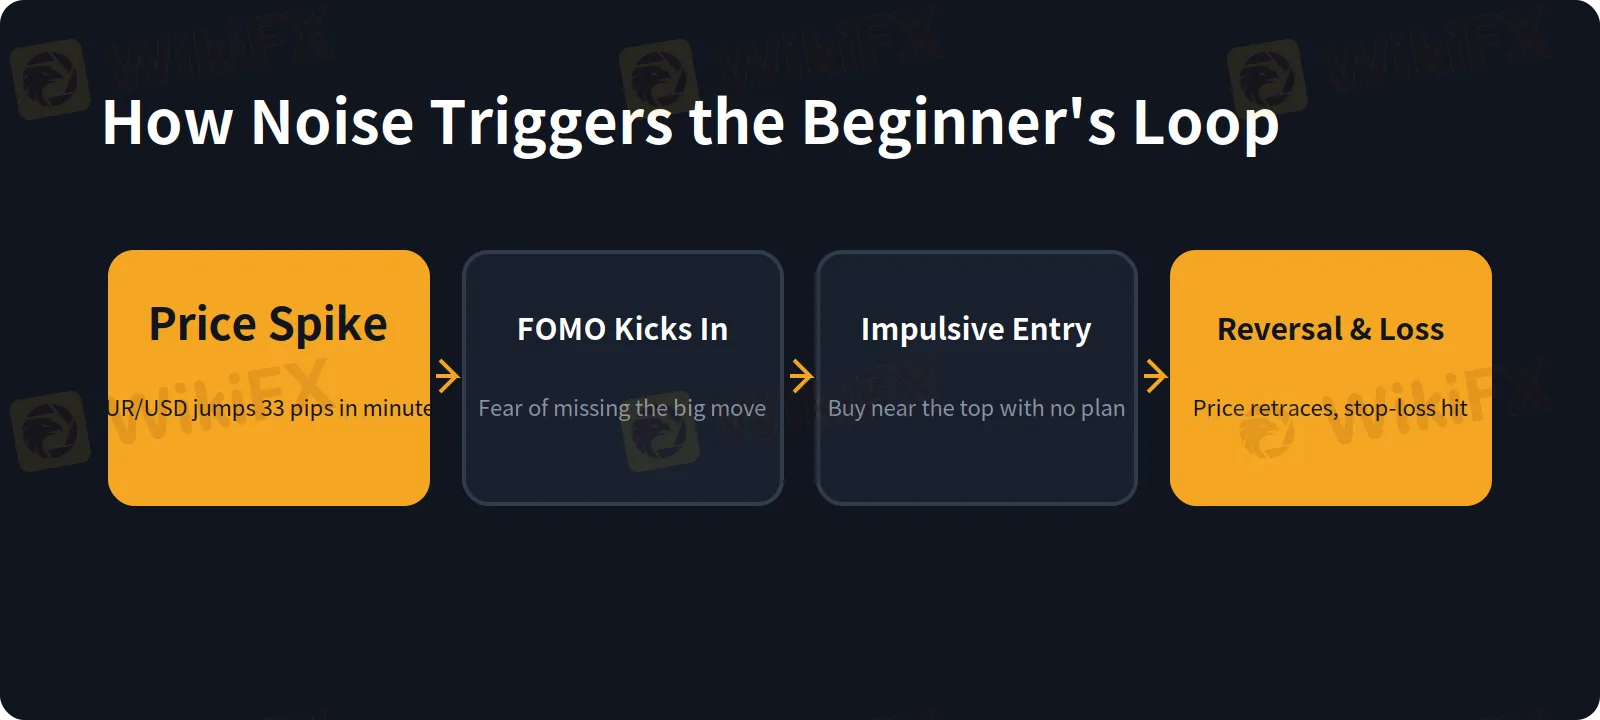
The typical cycle where noise is mistaken for a genuine signal.
Learning to Live with Noise
Noise cannot be eliminated, but understanding its nature shifts your perspective. The key is scale: what looks like chaos on a 5‑minute chart often appears as a tiny, insignificant wiggle on a daily chart.
Seasoned traders think in terms of “expected price range.” One common tool is the Average True Range (ATR), a technical indicator that measures market volatility by calculating the average range between daily high and low prices over a set period, commonly 14 days. For example, if EUR/USD has a 14‑day ATR of 0.0060 (60 pips), then a 25‑pip intraday move is well within normal noise and does not, by itself, call for a reaction. Even a 40‑pip spike might not be unusual. You can use the ATR to gauge whether a price thrust is just routine static or something worth noting.
Beyond numbers, accepting noise also means accepting that you cannot, and should not, catch every price movement. The market will always offer more opportunities. Treating every twitch as an urgent signal is like trying to drink from a fire hose: overwhelming and unsustainable. Instead, recognise that price oscillates randomly most of the time. The real challenge is not predicting the next small move, but ignoring the moves that don't matter.
To build that filtering habit, you can pause and ask yourself three simple questions before acting on a sudden price jump:
- Is this move larger than the pair's typical intraday range?
- What is the fundamental or technical reason this move should continue?
- Am I reacting out of fear or a calculated plan?
Answering honestly, even if the answer is “I don't know”, can save you from many impulsive trades.
Noise is the price we pay for a liquid, 24‑hour market. It is not your enemy; it is simply the market's breath. Once you stop trying to control it, you can focus on what really counts.
Disclaimer:
The views in this article only represent the author's personal views, and do not constitute investment advice on this platform. This platform does not guarantee the accuracy, completeness and timeliness of the information in the article, and will not be liable for any loss caused by the use of or reliance on the information in the article.
WikiFX Broker
Latest News
BX Trade Review: Is This Unregulated Broker Worth the Risk?
WikiFXSTMARKET Review: Withdrawal Complaints Cloud a Low-Rated Broker, What to Know Before You Deposit
WikiFXWhy the Dollar Moves Almost Every Forex Pair
WikiFXCONSOB Orders Blocking of 24 Unauthorized Investment Websites
WikiFXBitDelta Receives UAE Category 5 Licence for Introducing Activities
WikiFXRinggit Gains on Majors but Slips vs US Dollar Ahead of Fed
WikiFXtrading.com Review: FCA-Regulated, But Withdrawal Complaints Persist
WikiFXDeriv Review: What Traders Should Know Before Depositing
WikiFXDollar Steadies as Rupee Finds Market Support
WikiFXPRIME VEST SAFE Review: Is Your Deposit Safe?
WikiFX